- May 4, 2023
- Posted by: Muhammad Shoaib Afzal
- Category: XII. POS REPORTS
REPORTS CENTRE
The report center refers to a central platform within the Vaival-ERP system where users can generate, view, and analyze various reports on different aspects of the organization such as financial performance, sales, inventory, production, and more. The reports are based on data collected from multiple ERP and POS modules to provide insights into various business processes and operations. A report center is an essential tool for decision-making, performance evaluation, and continuous improvement. We will discuss detailed POS Reports in this blog.

POS Reports:
These reports are typically accessible through the POS software’s reporting module or dashboard and can be exported to various formats for further analysis. It has multiple reports such as daily sales data report, shift closing report, update in any transactions and many other reports shown below will discuss in detail.
Figure: Report Centre > POS Report

1- Shift Closing Report:
This report is used to communicate important information to management and help ensure a smooth transition between shifts. It is an important tool for tracking performance and making decisions about staffing, inventory, and other operational needs.
To view this select the shift date and click on the “VIEW” button to view the daily shift closing report. it will show the total collection by adding your collections via different payment methods such as cash, credit & others.
Figure: Report Centre > POS Report > Shift Closing Report

2- Daily Sales Report:
A daily sales report in the report center is a document that provides a summary of all sales transactions that took place within a specified day. The report typically includes information such as the total amount of sales, the number of transactions, the average transaction value, and the most popular items sold. It can also include information about payment methods, discounts, and taxes. The daily sales report is used to track the performance of a business, monitor cash flow, and make informed decisions about inventory, staffing, and other operational needs. This information is directly synced from the POS system and is often used as a tool for monitoring and analyzing business performance.
Figure: Report Centre > POS Report > Daily Sales Report

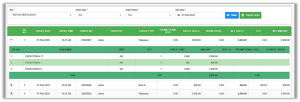
To view this select the site, order types such as (dine-in, takeaway, delivery & all), order status such as (sale, return, FOC), and sale date (specific date) and click on the “VIEW” button to view the list of all transactions performed in a specific day performed by specific users. This report will show the sum of all gross sales, discount amounts, net sales, GST amounts, and net amounts. By clicking on the “Plus Sign”, you can view the details of a single transaction as shown below in the figure. It will display the quantity of items, price per unit, total amount, and change order status that will show the trail of an item such as deleted items/added items after order placement. This report can be exported in Excel format for further use by clicking on the “EXPORT EXCEL” button.
Figure: Report Centre > POS Report > Daily Sales Report 2
3- Date Wise Sales Report:
A date-wise sales report in the report center is a document that provides a summary of all sales transactions that took place within a specific date range according to your desire as shown below in the figure.
Figure: Report Centre > POS Report > Date Wise Sales Report
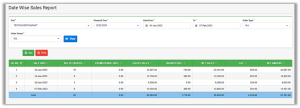
To view this report select the site, financial year, date from (starting date as per your desire), To date (ending date), order types such as (dine-in, takeaway, delivery & all), order status such as (sale, return, FOC) and click on the VIEW button to view the list of all transactions performed in a specific date range. This report will show the sum of all gross sales, discount amounts, net sales, GST amounts, and net amounts. This report can be exported in Excel format for further use by clicking on the xlsx button and can take print by clicking on the PRINT button.
4- Category Wise Sales Report:
A category-wise sale report in the report center is a document that summarizes the sales performance of different categories of menu items over a specific period, such as a day, week, or month. The categories may include items such as appetizers, entrees, desserts, drinks, etc.
Figure: Report Centre > POS Report > Category Wise Sales Report
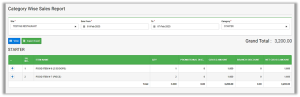
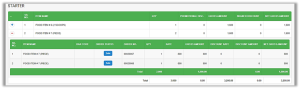
To view this report select the site, date from (starting date as per your desire), To date (ending date), and category such as (BBQ, starter, drinks, etc.) and click on the VIEW button to view the list of all transactions performed on the basis of a specific category in a specific date range. This report will show all items under a specific category, and the sum of quantities of that item. It also shows the grand total of all items lying under a specific category. By clicking on the “Plus Sign”, you can view the details of different menu items and keep track of your inventory as shown below in the figure. This report can be exported in Excel format for further use by clicking on the EXPORT EXCEL button.
Figure: Report Centre > POS Report > Category Wise Sales Report 2
5- Order Taker Wise Sales Report:
An order taker-wise sales report is a document that summarizes the sales performance of individual order takers in a restaurant or other hospitality setting. The report typically includes information such as the total sales generated by each order taker, the average sale value, and the number of transactions. This type of report can be useful for tracking performance, identifying top-performing order takers, and making decisions about staffing and training.
Figure: Report Centre > POS Report > Order taker Wise Sales Report
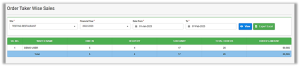
To view this report select the site, financial year, date from (starting date as per your desire), and to date (ending date), and click on the VIEW button to view the list of all transactions performed by different order takers in a specific date range. This report will show the number of all transactions based on order types such as dine-in, takeaway, delivery, and the sum of the order’s amount. This report can be exported in Excel format for further use by clicking on the EXPORT EXCEL button.
6- Change Orders Report:
It is necessary to keep track of updates or any modifications in order from our POS system. Therefore, this report is introduced to represent all updated orders from our daily transactions. The updated menu item will be reflected in the order history in our POS as well as in ERP and can be sent to the kitchen or bar for preparation.
Figure: Report Centre > POS Report > Change Orders Report
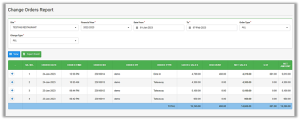
To view this report select the site, financial year, date from (starting date as per your desire), and to date (ending date), order types such as (dine-in, takeaway, delivery & all), change types such as (addition, deletion) and click on the VIEW button to view the list of all transactions in which menu items are updated by specific users in a specific date range. This report will show the number of all transactions based on order types such as dine-in, takeaway, delivery, and change types such as item deletions or additions. After selecting “Addition” as a change-type system will show a list of all orders in which new items are added after order placement. After selecting “deletion” as a change-type system will show a list of all orders in which existing items are deleted after order placement. This report can be exported in Excel format for further use by clicking on the EXPORT EXCEL button.
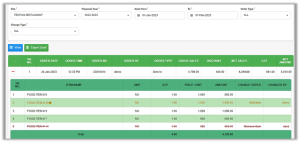
By clicking on the “Plus Sign”, you can view the details of modified menu items and keep track of your inventory as shown below in the figure.
A highlighted item with a star sign is represented as a new item added in the respective order. Added item’s status will be “Add Item” In the change order column. Deleted will be represented as a strikethrough of a menu item name. Deleted item’s status will be “Remove Item” In the change order column.
Figure: Report Centre > POS Report > Change Orders Report 2
7- Recipe Margin Report:
A recipe margin report is a document or analysis that calculates the profit margin for a specific recipe or set of recipes in the food industry. The report takes into account the cost of ingredients as raw materials and then compares them to the selling price of the dish to determine the profit margin. This information is highly beneficial for restaurants and other food businesses in setting menu prices, controlling food costs, and making informed decisions about their menu offerings.
Figure: Report Centre > POS Report > Recipe Margin Report

To view this report select the site, a category such as (BBQ, starter, drinks, etc.), and the Item name that is lying under that category, select the date when you have to compare and click on the VIEW button to view the list of items under a specific category with their units and SKUs. This report will calculate the profit margin by comparing the purchase price of all raw materials used in the recipe of those items and the sale price of that recipe items. By clicking on the “Plus Sign” you will see all items with their quantity and prices/unit and at the end, there is the total cost of that recipe item, and the gross margin (%) calculated by the system is displayed.
These reports can be exported in Excel format and Pdf format by clicking on Recipe Margin.xls button and Recipe Margin.pdf button.
Overall, this margin is an important metric in business as it provides insight into the profitability of an organization and helps to inform pricing, production, and budgeting decisions. A high-cost margin indicates that a company is making good profits on its products or services, while a low-cost margin could indicate the need for cost-cutting measures or a reevaluation of pricing strategies.
8- Menu Rates:
Menu item rates refer to the prices of individual food items or dishes listed on a restaurant or food establishment’s menu. Restaurants and food businesses must also consider market trends and competition when setting menu item rates, as well as customer demand and perception of value. Menu item rates may change over time based on changes in ingredient costs, market conditions, or changes in the business’s financial goals. You can check this report in order to view the prices of items on a regular basis and keep track of rates according to market competition and many other factors.
Figure: Report Centre > POS Report > Menu Rates
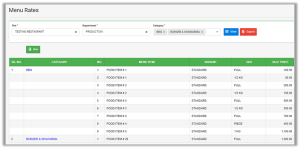
To view this select the site, department such as (store, or production), can select multiple categories such as (BBQ, starter, drinks, etc.) and click on the VIEW button to view the list of menu items under a specific category with their sale prices, units, and SKUs. This report can be exported in Excel format and also in PDF format.
9- Cost of Production:
This report refers to the total expenses incurred in producing a product or delivering a service. This report can track and manage these costs in real-time, allowing organizations to accurately calculate the cost of production for each product or service they offer. This information can be used to improve decision-making in areas such as pricing, production planning, and inventory management. By having up-to-date and accurate information on the cost of production, organizations can improve their margins, make informed business decisions, and ultimately drive profitability.
Figure: Report Centre > POS Report > Cost of Production
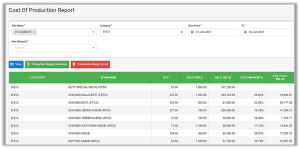
To view this select the site (can also select multiple), can select multiple categories such as (BBQ, starter, drinks, etc.), date from (starting date as per your desire), To date (ending date), and click on the VIEW button to view the list of raw materials items used in the recipe items under a specific category with their sale prices, units, and SKUs. It will calculate the estimated cost price and cost margin(%) after getting the prices of all raw materials used in that recipe. This report can be exported in Excel format and also in PDF format.
10- POS Sales Analysis:
This report is very fruitful for restaurants and other food businesses, it will directly benefit the client’s needs such as restaurant managers and owners to track their daily sales by different filtering methods such as different time slots, by most visited customers, and by sitting tables. POS analysis reports can help owners identify areas for improvement in the customer experience, such as checkout speed, ease of use, and product availability. This information can be used to make changes that enhance the customer experience and increase customer satisfaction. This report can be used to optimize processes, reduce waste, and improve overall performance. We will discuss below different analysis types in detail.
By Timeslot: This report will analyze sales data over specific periods of time, such as daily, weekly, or monthly time slots. This type of analysis helps business owners understand how sales and customer behavior vary across different times of the day, week, or month. This report will show all transactions performed in a single hour and calculates the average sales respectively within a desired date range.
By clicking on the drill-down icon, you can view the detail of each transaction based on hours with every detail such as (order date, order time, order by, order type, discount, GST on order, Net sales, and Delivery charges) as shown below in the figure.
Figure: Report Centre > POS Report > POS Sales Analysis

By analyzing sales data by time slot, owners can identify areas for improvement in the customer experience, such as reducing wait times, improving product availability, and enhancing convenience for customers during rush hours.
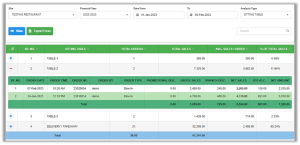
By Sitting Table: Table management in a restaurant involves organizing and coordinating the seating arrangements and operations of tables in the dining area. Our POS management allows restaurant managers to manage tables such as assigning tables to customers, keeping track of table availability, balancing the flow of customers, and ensuring efficient table turnover. This POS analysis type can help to improve the overall customer experience, maximize seating capacity, and increase sales and revenue. This report will show table-wise transactions performed in a specific date range from our POS. This will also show other transactions like delivery and takeaway as shown below in the figure.
Figure: Report Centre > POS Report > POS Sales Analysis 2

By clicking on the drill-down icon, you can view the detail of each transaction based on sitting tables, takeaway/delivery with every detail such as (order date, order time, order by, order type, discount, GST on order, Net sales, and Delivery charges) as shown below in the figure.
Figure: Report Centre > POS Report > POS Sales Analysis 3
By Contact No.: Restaurant reports by customers refer to reports that provide insights into customer behavior and preferences. These reports can include information such as the number of customers, frequency of visits, average check size, and menu items purchased. This information can be used by restaurant owners and managers to make informed business decisions and improve the customer experience. In POS, customer information will be saved by cashiers with their contact numbers and will be synced in our ERP, so we can keep track of our daily and weekly sales by customers’ names and contact numbers. This report will also calculate the average sale of our daily and weekly transactions and the percentage of total sales by a specific customer.
Figure: Report Centre > POS Report > POS Sales Analysis 4

At the end of the customer’s list, “OTHERS” will be represented as a detail of all transactions that don’t have customers’ information like contact numbers.
By clicking on the drill-down icon, you can view the detail of each transaction based on the customer’s information with every detail such as (order date, order time, order by, order type, discount, GST on order, Net sales, and Delivery charges) as shown below in the figure.
Figure: Report Centre > POS Report > POS Sales Analysis 5